Introduction
In the world of data visualization, RAWGraphs stands out as an intuitive and open-source tool designed to bridge the gap between spreadsheets and data visualization. Whether you're a journalist, researcher, or business analyst, RAWGraphs provides a user-friendly, code-free way to transform raw data into meaningful visual representations.
Many professionals struggle with creating compelling data visualizations due to software limitations or a lack of technical expertise. RAWGraphs addresses this issue by offering an accessible, powerful, and customizable platform for data visualization. With its extensive chart types and drag-and-drop functionality, anyone can turn complex datasets into engaging, easy-to-interpret graphics.
Installation & Setup
Using the Online Version
No installation is required. Simply visit RAWGraphs.io and start visualizing data instantly.
Installing RAWGraphs Locally
- Clone the Repository
git clone https://github.com/rawgraphs/rawgraphs-app.git cd rawgraphs-app - Install Dependencies
npm install - Run the Development Server
npm start
Open http://localhost:3000 in your browser to access RAWGraphs.
How to use
RAWGraphs offers a simple yet powerful interface for creating visualizations. Here's a basic overview of the process:
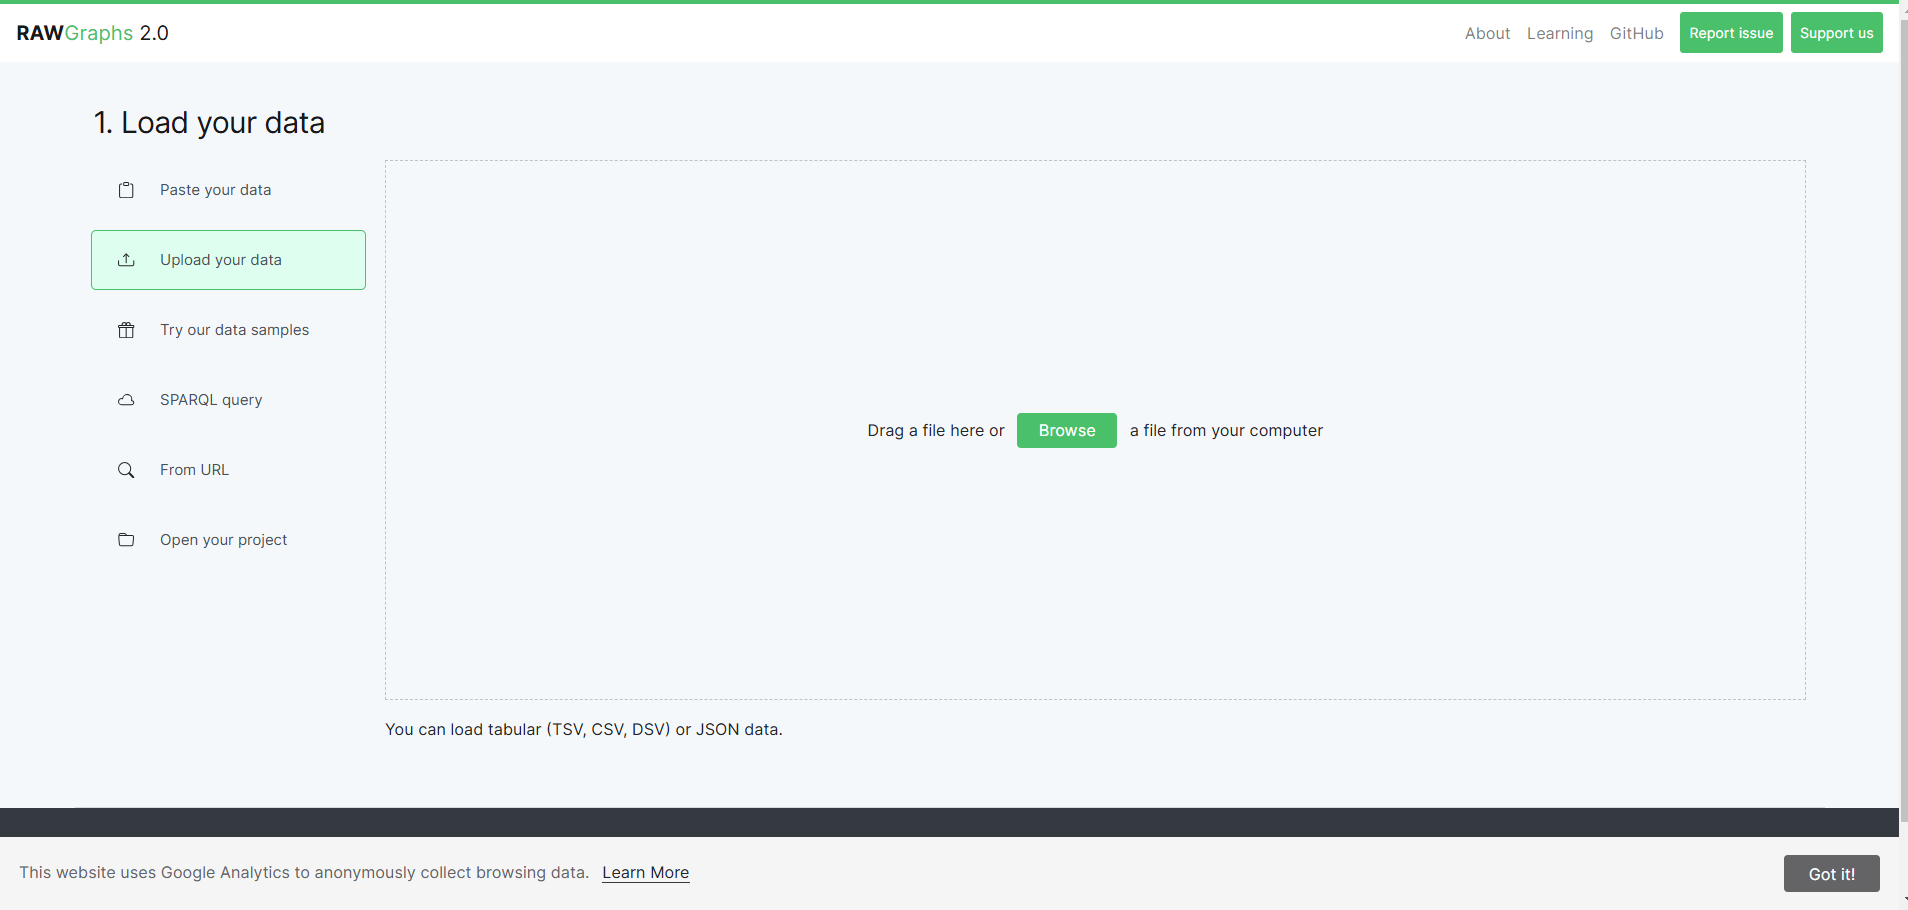
- Import Data: Upload your dataset in CSV, TSV, or JSON format.
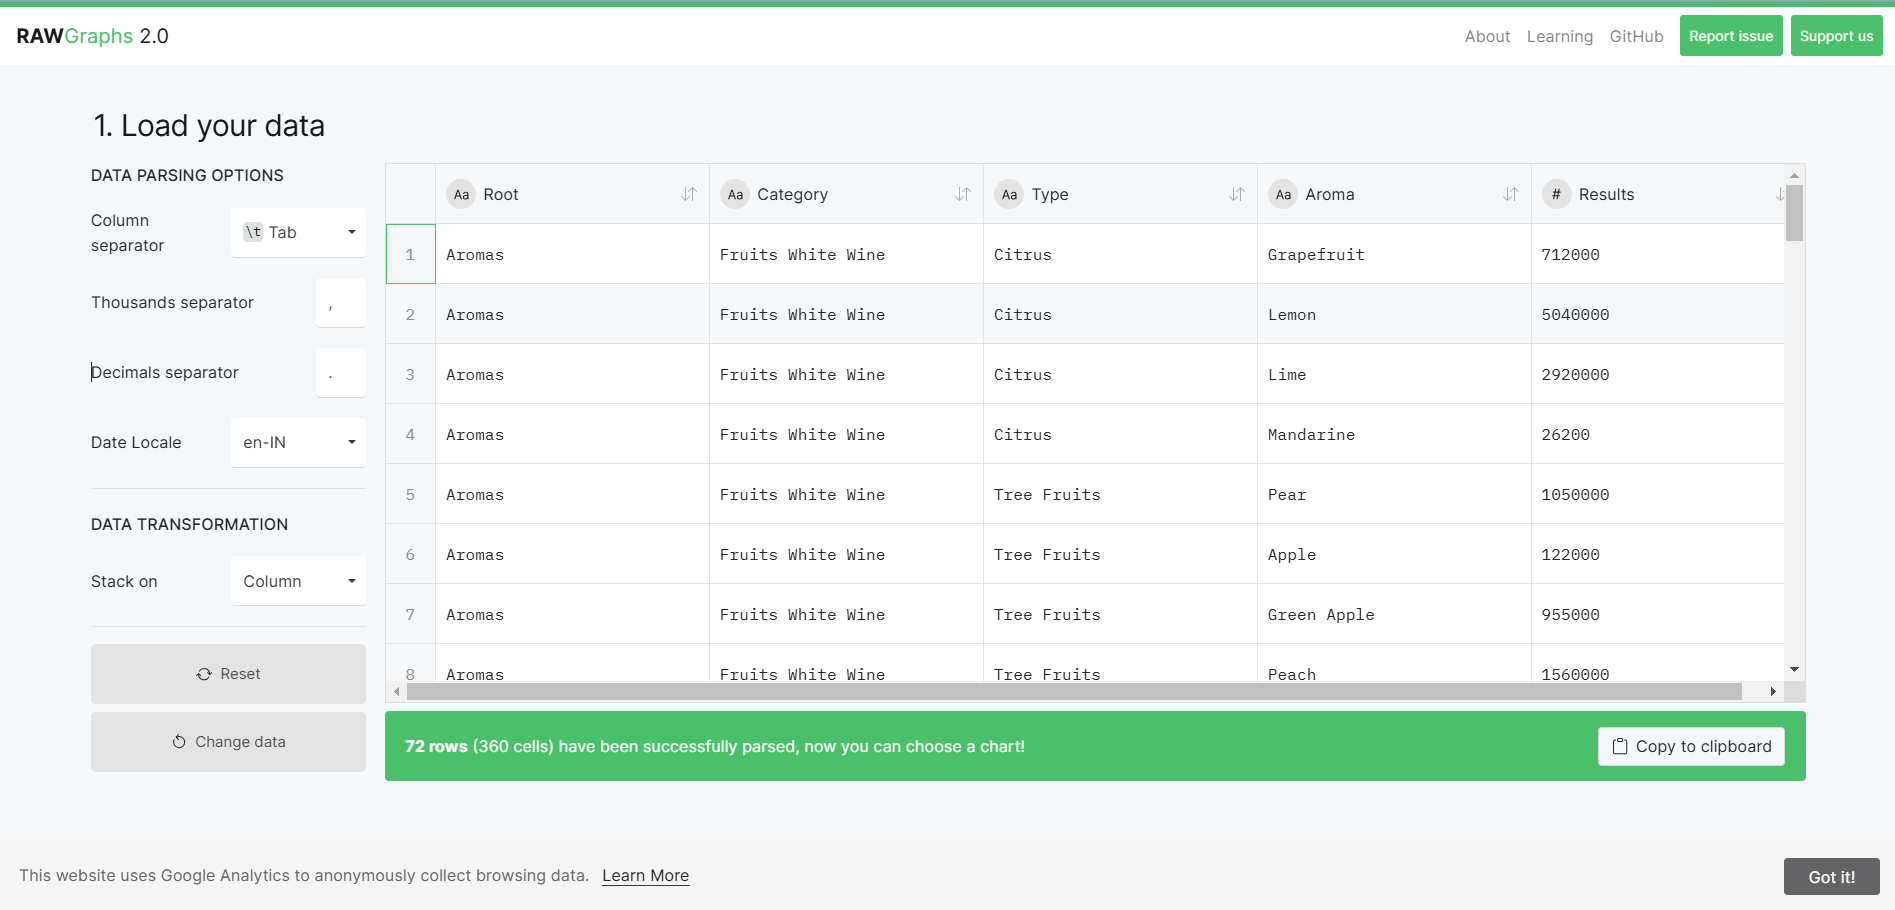
- Configure Data: Define the structure of your data, including column types and formats.
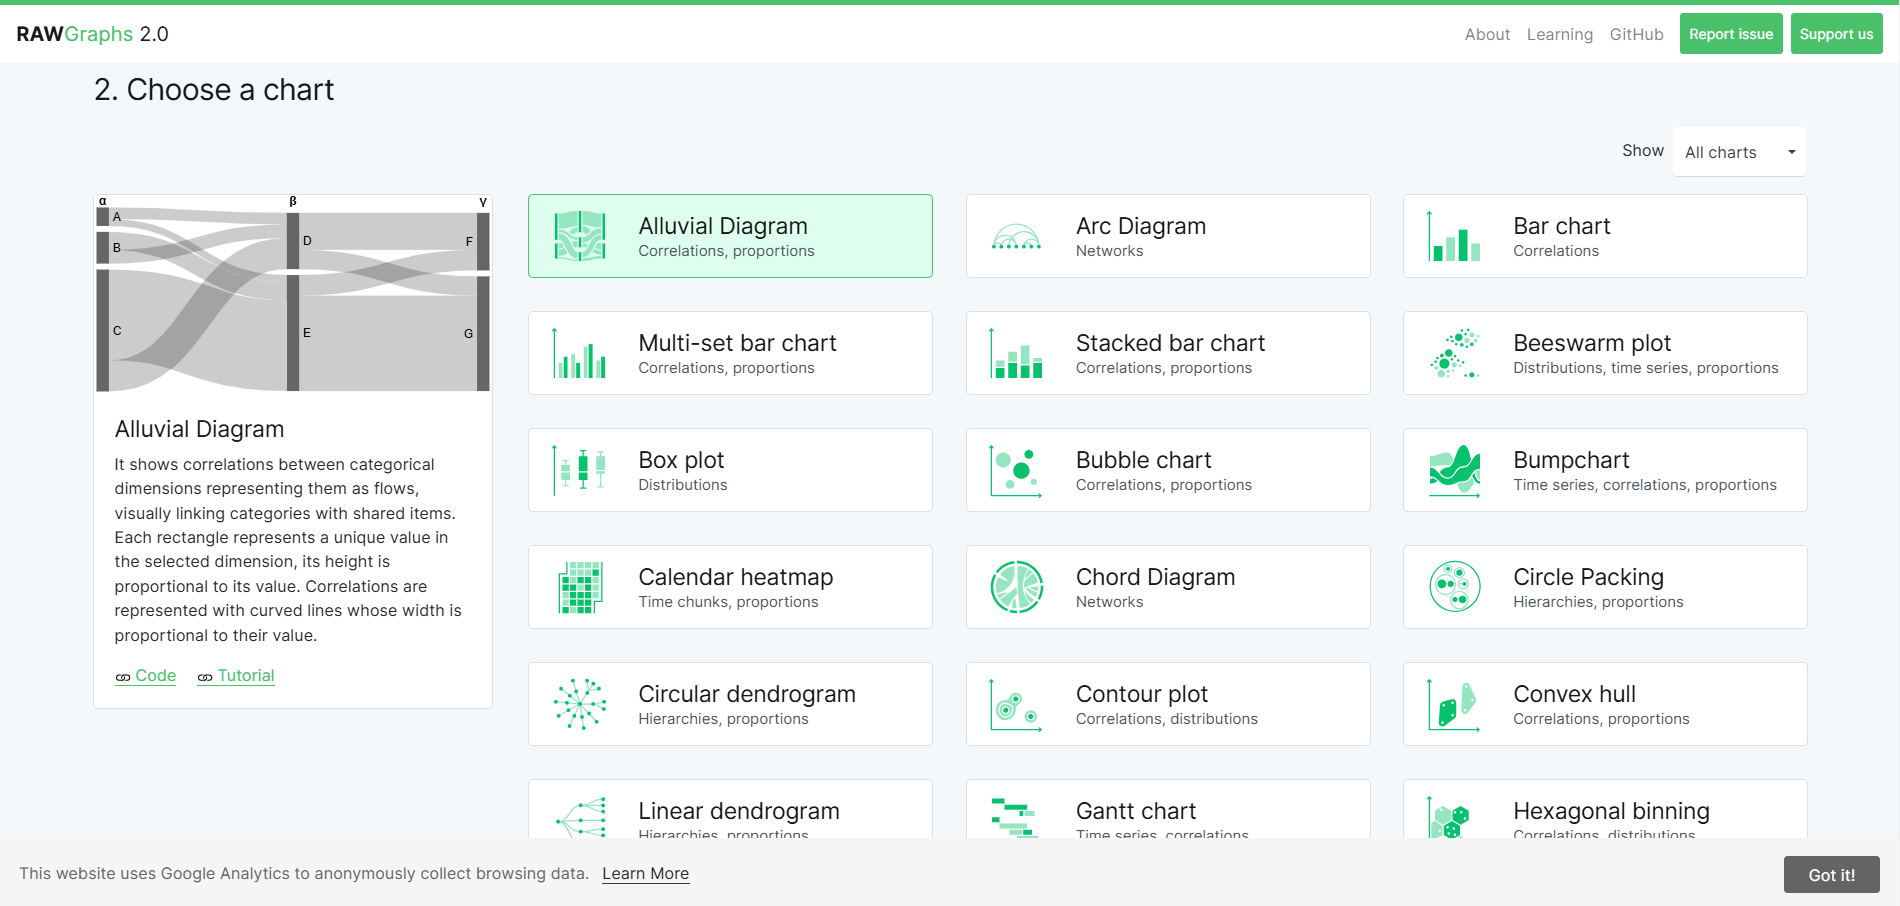
- Choose a Chart Type: Select from a variety of chart types, including bar, line, scatterplot, and more.
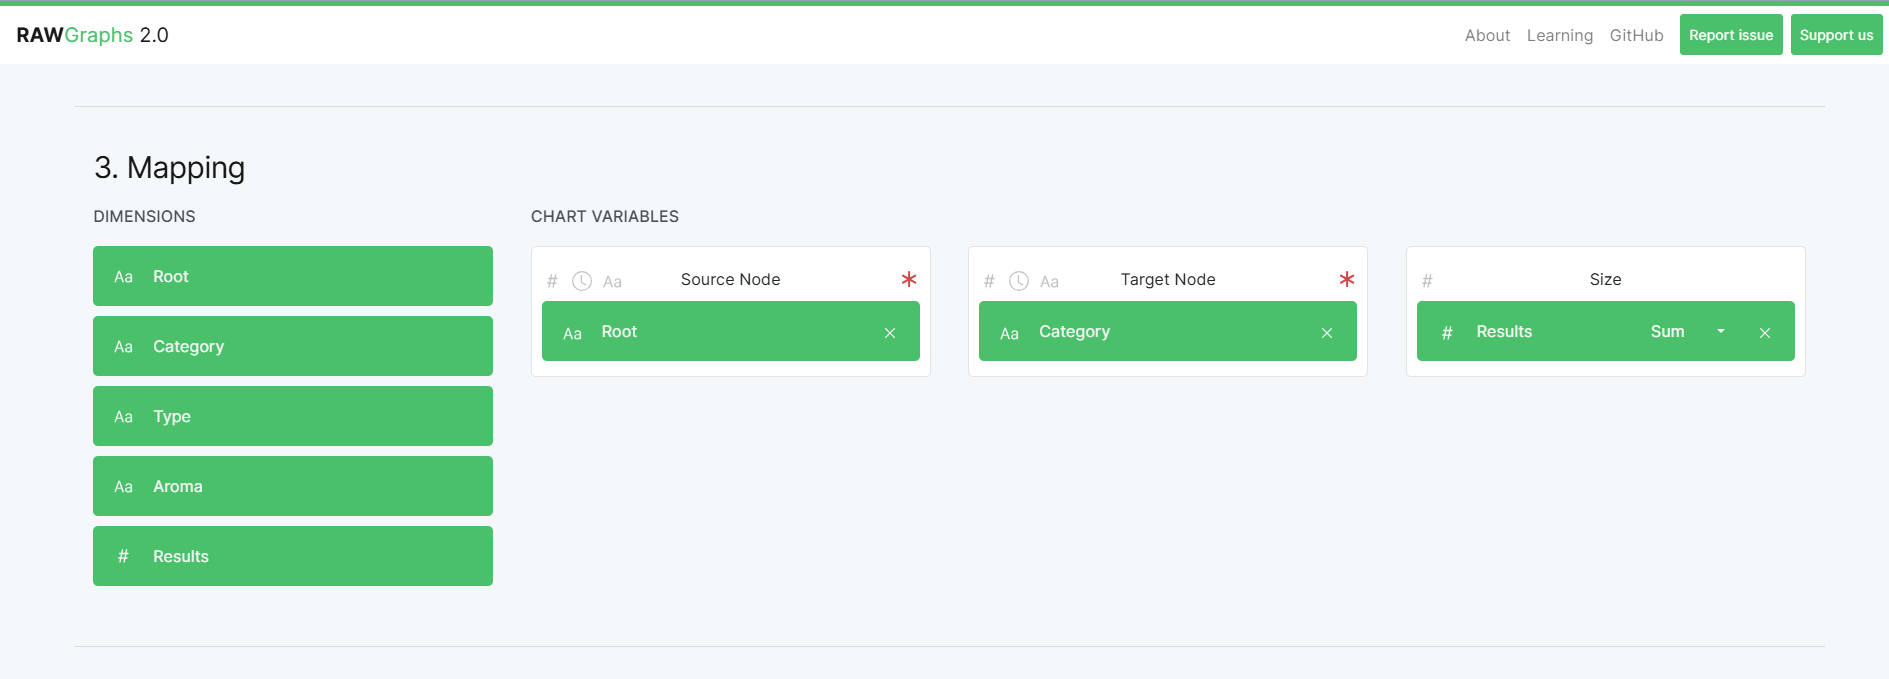
- Map Data: Assign data columns to visualization properties like X and Y axes, color, size, and labels.
- Visualize Data: View your data as a chart and interact with it to explore different aspects.
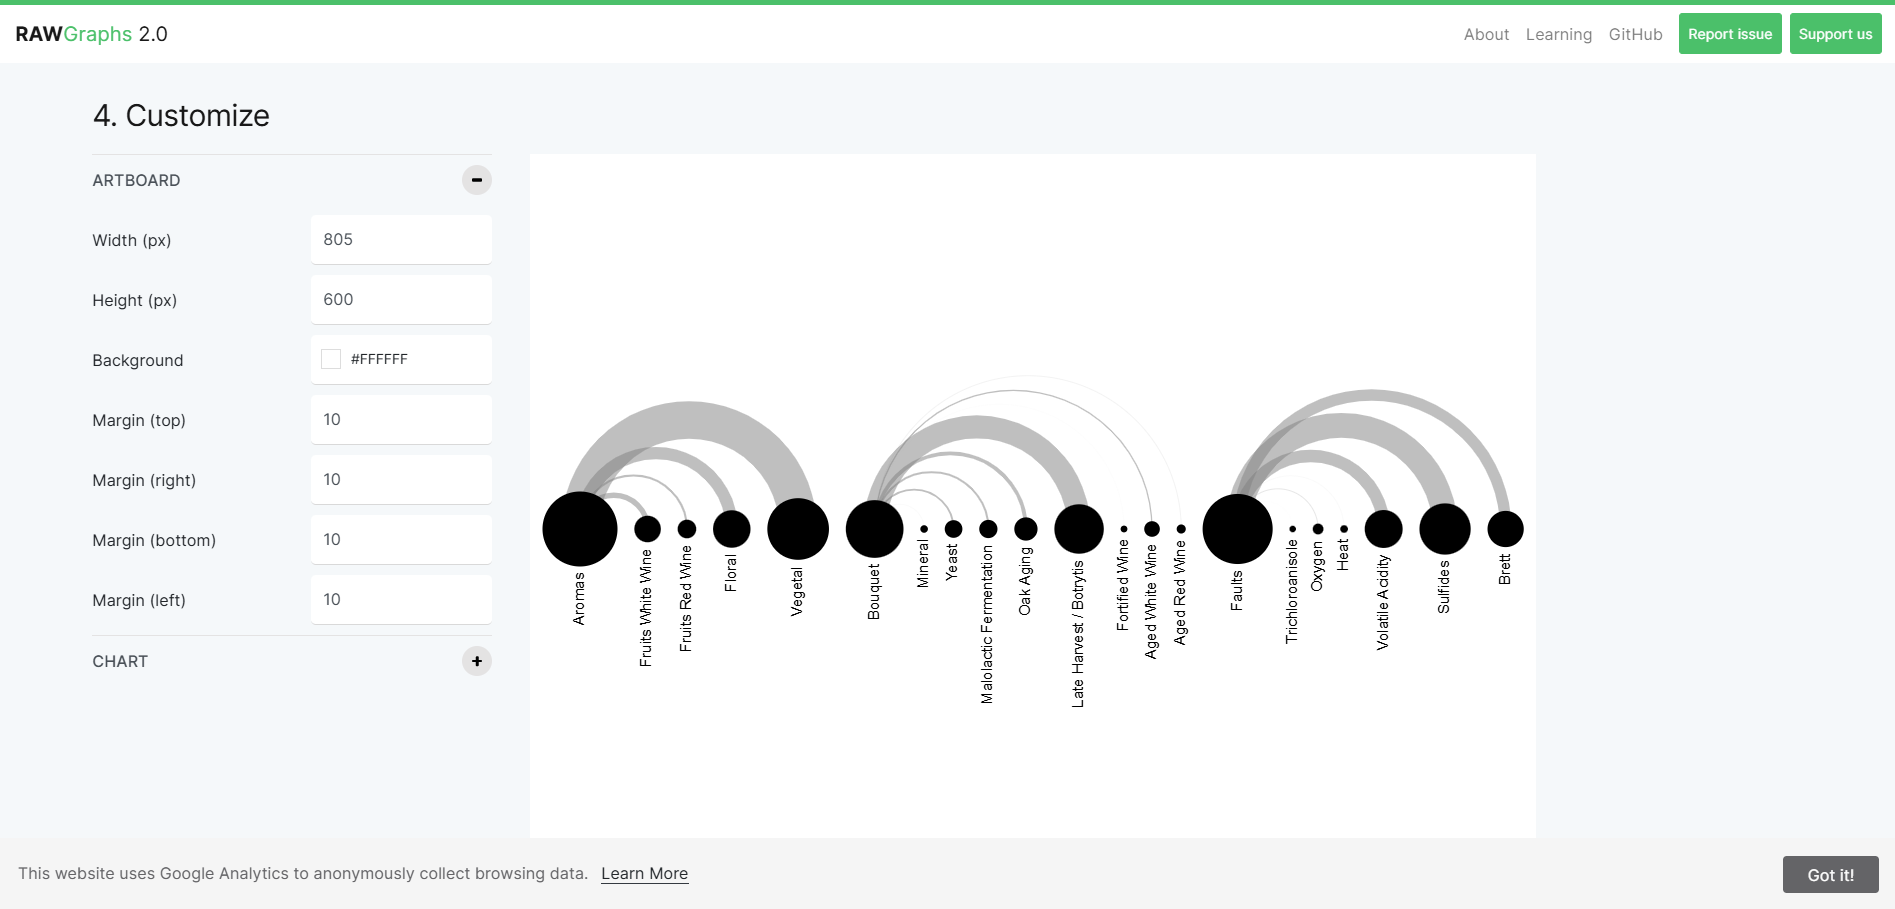
- Customize Appearance: Modify colors, fonts, labels, and other visual elements to suit your preferences.
- Save & Share: Save your visualization for future reference or share it with others via a unique URL.
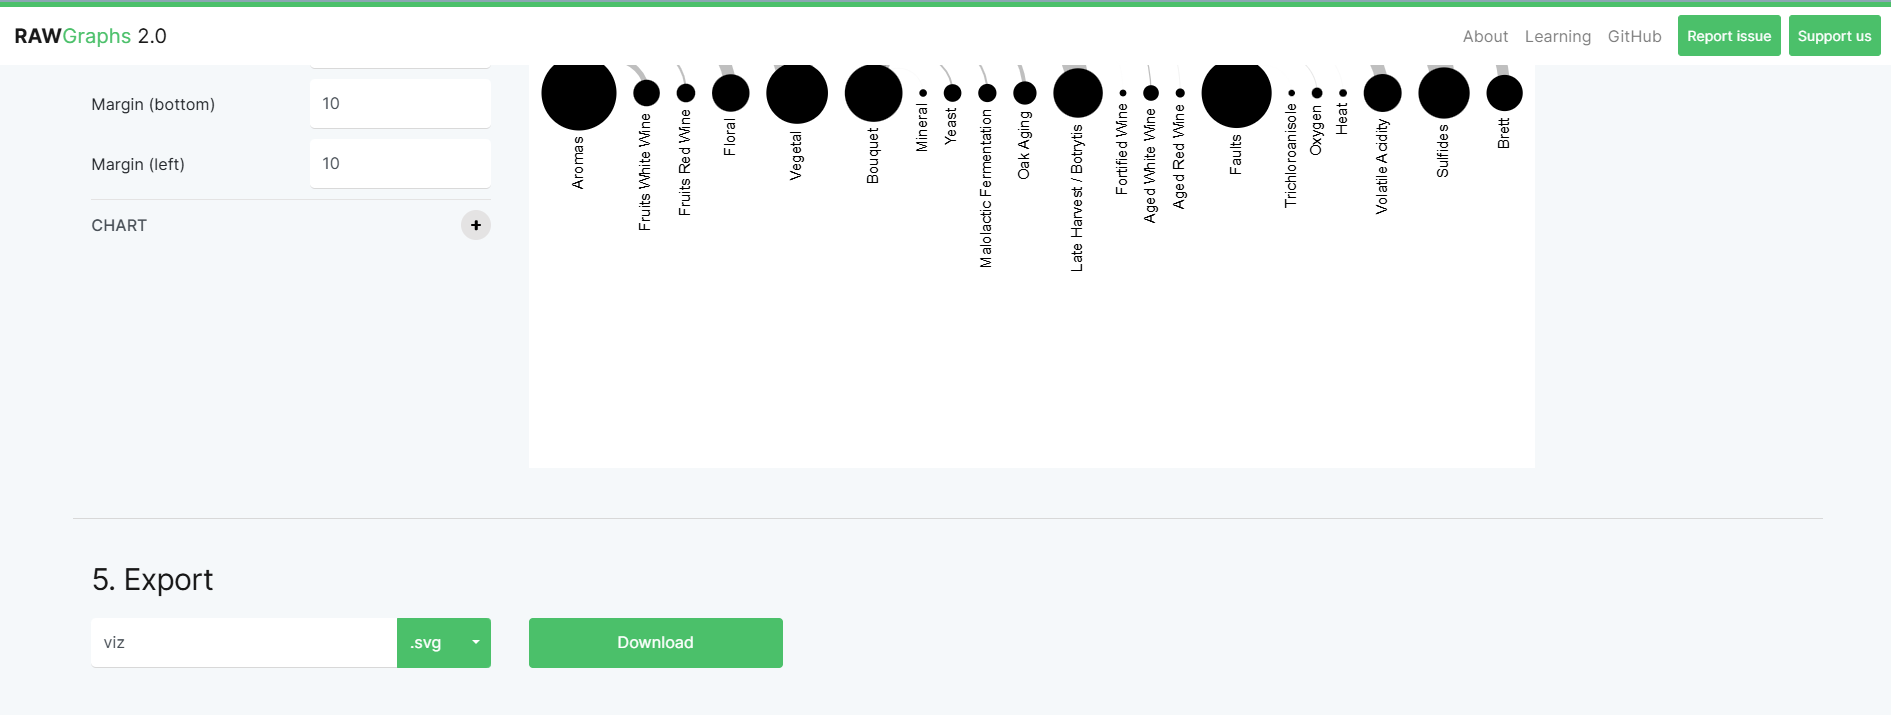
- Export Visualization: Save your visualization as an image (PNG or SVG) or download the data and configuration as a JSON file.
Key Features
- Supports Multiple Data Formats Import data in CSV, TSV, or JSON formats seamlessly.
- Customizable Charts Choose from a variety of chart types, including bar, line, and scatter plots, tailoring each to your specific needs.
- Drag-and-Drop Interface Easily map your data to visualization properties with a user-friendly interface.
- Export Options Save your visualizations as PNG or SVG images, or export the data and configuration as JSON for further use.
- Modular & Extensible Being open-source, RAWGraphs allows for customization and extension to fit various project requirements.
Use Cases
- Journalism: Journalists can use RAWGraphs to present investigative data visually, making stories more engaging and easier to understand.
- Research & Academia: Researchers can visualize complex data sets for analysis and publication.
- Business Intelligence: Companies can create dashboards and reports to analyze market trends and performance metrics.
- Design & Art: Artists and designers can use RAWGraphs to explore creative visualizations of abstract data.
Frequently Asked Questions
Why should I use RAWGraphs?
RAWGraphs is perfect for those who need to create complex visualizations quickly without the need for coding expertise. It allows full customization and supports a variety of data formats.
How does RAWGraphs compare to other visualization tools?
Unlike traditional tools like Excel or Tableau, RAWGraphs offers greater flexibility with data transformation, supports open-source development, and provides an easy-to-use drag-and-drop interface.
Can I export my RAWGraphs visualizations?
Yes! RAWGraphs allows you to export your visualizations as SVG, PNG, or JSON files for further customization or sharing.
Conclusion
RAWGraphs is an invaluable tool for professionals and enthusiasts looking to create complex data visualizations effortlessly. Its open-source nature and versatility make it a go-to solution for anyone working with data.